Present Value and Internal Rate of Return are not difficult concepts to understand. T ake a look at the Cheat Sheets I’ve prepared along with 2 very short videos to explain these concepts.
For 20+ years, I’ve been carrying an old plastic card around in my wallet that is a great cheat sheet for investment-minded folks to quickly assess various return options.
I decided to recreate it here because it’s very useful as a handy cheat sheet you can use for quick reference. (You can click on the table to open a printable image.)
You just won the $10 million lottery
Let’s have some fun and assume you just won a $10 million lottery jackpot in California’s MEGA Millions game.
(It isn’t a perfect example because the payments are made annually over many years; our Present Value table only applies to a one-time lump sum payment, but the principles are the same.)
If you read the FAQs of California MEGA Millions, it says
If I win the jackpot, what are my payout options?
Jackpot prizes are paid in 30 annual payments. However, after you win the jackpot and your prize is validated by the Lottery, you will have 60 days to choose the cash value of the prize instead of 30 annual payments. For more information on jackpot payout, view the Winners Handbook.
So, if you win $10 million, you certainly won’t be getting a check for $10 million, will you? No, but you will get to choose between a 30 year payout and the ***cash value of the prize***.
How much is my cash prize?
$2.4 million. Thanks for playing.
What? How can that be? I thought I won $10 million.”
In simple terms, the $10 million you won that will be paid annually over 30 years isn’t worth $10 million today. It will be worth that in 30 years.
For our simple example, we’ll reduce the number of years to 15 so we can use the Present Value table, above. (The same principles apply for a 30 year table or for any number of years.)
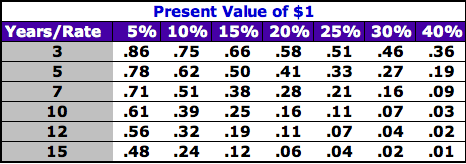
What can you learn from the Present Value table?
One place we’ll find the theory behind their calculation is by finding .24 in the Present Value table.
You’ll see it at the intersection of the column showing a 10% rate and the row showing 15 years.
The .24 result means that the Present Value of $10 million paid to you in 15 years, assuming an earnings rate of 15%, would be worth only $2.4 million today.
Said another way, if we give you $2.4 million today and you invest it for 15 years at 10%, you’ll receive $10 million at the end of 15 years.
That’s what Present Value is all about.
[pullquote]Don’t gamble; take all your savings and buy some good stock and hold it till it goes up, then sell it. If it don’t go up, don’t buy it. ~ Will Rogers[/pullquote]
Here’s another way of looking at it.
In reverse, let’s say you were considering an investment where you expected to receive a 15% rate of return over a 5 year period. Your dollar is worth only about $.50 today.
Why? Because if you invested $.50 today for 5 years with an expected 15% annual rate of return, you’d have about $1.00 at the end of 5 years.
Take a look at the short video below where I explain how to use this simple table.
The Present Value of $1: An Explanation from Lary Kirchenbauer on Vimeo.
Internal Rate of return (IRR)
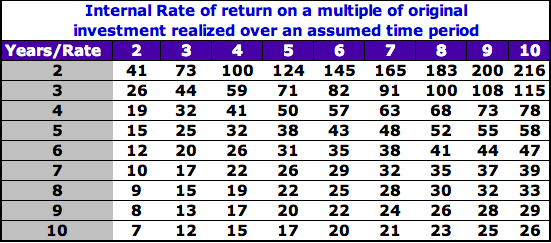
The second chart, the Internal Rate of return (IRR), is useful when you consider what multiple of your investment you’d like to achieve over a certain period of time.
Let’s say you’re wondering about the rate of return that an investor might be seeking in an investment in a company, maybe yours.
In the example below, let’s assume this particular investor expects to achieve a 5X return of capital during the period of his investment. She also expects to get her money back in 5–7 years.
Using the table, you could quickly determine that her target rate of return, or IRR (internal rate of return), must be somewhere between
- 32% over 7 years (look down Column One to the “5” year line, then across to the 5X expected return column), and
- 38% over a 5 year time frame (look down Column One to the “7” year line, then across to the 5X expected return column).
Take a look at the short video below where I explain how to use this simple table.
Internal Rate of Return: An Explanation from Lary Kirchenbauer on Vimeo.
You can verify it by multiplying any investment amount by 132% (1.32) over 5 years to see that it is 5X the original amount.
Print these and fold them up in your wallet. You’ll be surprised how often you’ll refer to them.
I have a question for you: how will you use these concepts in your personal or professional life? Will they help you take a quick look at some of your investment decisions? Be sure to visit our Facebook Page or @Exkalibur on Twitter to share your thoughts and comments.